
Introduction
California has some of the highest electricity rates in the United States. Current projections suggest that increases will continue to outpace inflation in future years.
Most of the debate around energy costs is focused on rates, utility bills, or the underlying costs driving rate increases, with some attention given to variance across utilities or service areas. While these questions are all important, we take a different approach in this report.
Who can afford their home energy costs and who cannot? That is the question examined in this Data Brief. To answer this question, we analyze U.S. Census American Community Survey (ACS) data through standard global measures of home energy affordability (See methodology). Data on who exactly is struggling to pay home energy bills is critical to crafting a practical and equitable solution to the problem of rising costs.
Home energy costs are considered unaffordable when more than 6% of household income goes toward utility bills for power, heating, and cooling,1 with those spending at this level defined as “energy burdened.”
Our analysis finds that more than 5.2 million California adults are energy burdened by this standard measure.
Women are significantly more likely than men to be spending an unaffordable share of income on home energy costs. This is true within nearly every group. It is true within all major racial and ethnic groups. It is true for seniors and parents. It is true for renters and homeowners alike. Single mothers struggle more to pay electric bills than single fathers; women-led households struggle more than men-led and couple-led households.2
In this, California unfortunately aligns with the global pattern. Throughout the world, women are at greater risk than men of being energy burdened—in wealthy democracies, as well as in low and middle income countries.3
The ability to afford energy to power, heat, and cool one’s home is a critical determinant of health and well-being. As California pursues its ambitious transition to clean energy, policymakers must act to make energy costs affordable for those who are struggling the most to pay their utility bills and make ends meet.
Key Findings
- 1 in 5 women face unaffordable energy costs and are energy burdened
- 6 in 10 lower-income women are energy burdened
- Nearly 1 in 3 Black women are energy burdened
- 29% of senior women are energy burdened, including 40% of older Black women, compared to 25% of senior men
- 31% of women-led households are energy burdened, compared to 24% of men-led households and 16% of households led by couples
- 37% of families headed by single mothers are energy burdened, compared to 28% of those headed by single fathers
61% of adults with household income under $50K are energy burdened. Most of these lower-income adults are women.
Among adults with annual household income under $50,000, 61 percent face unaffordable costs for home energy. While similar shares of women (61%) and men (60%) in this bottom quartile of income are energy burdened, women make up the majority (56%) of this group. They are more than eight times as likely to struggle paying energy bills as Californians in the third quartile (adults with household income $95,200 – $167,000), of whom only 7% of are energy burdened.
More than 1 in 5 (22%) middle-income Californians also struggle with energy costs.
Among California’s highest earners, those with household income above $167,000, only 1% are energy burdened. Compared to them, lower-income women are 61 times as likely to be energy burdened.
Figure 1: Percentage of energy burdened adults, by household income and gender, California 2023
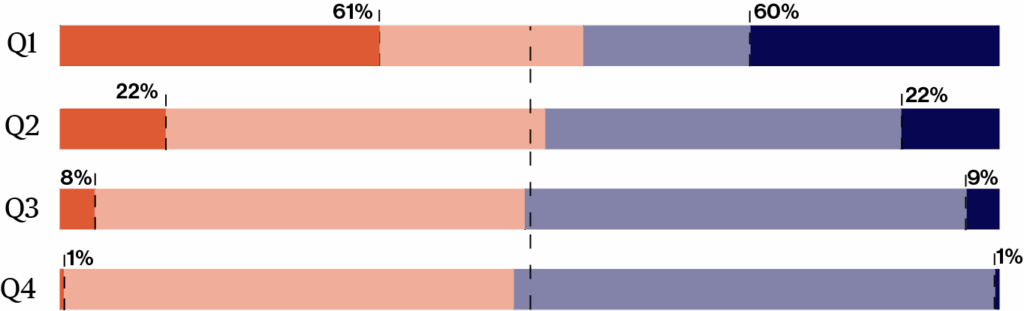
Each bar represents 100% of the adult population with income within the represented income quartile; the vertical dotted line marks 50% of the quartile's population. State income quartiles are: Q1 = < $49,600; Q2 = $49,600 - $95,200; Q3 = $95,500 - $167,000; Q4 = $167,000 - $741,600. The gender breakdown of each quartile is shown in orange (women) and indigo (men). Darker sections indicate the energy burdened share of the income group by gender. Source: Gender Equity Policy Institute analysis of ACS 2023.
Significant gender gaps by race and ethnicity, with women consistently more energy burdened than their men counterparts
Among all major race and ethnicities, there is a significant gender gap, with higher shares of women than men bearing high energy costs.
Black women are among the most likely to face high home energy costs. They are 2.6 times as likely to be energy burdened as Asian men and roughly 2 times as likely as White men. Black men are also significantly more energy burdened than Asian, White, and Latino men and women.
Asian men and women have the lowest rates of energy burden, at 12% and 13% respectively. That is significantly lower than all other race/ethnicity groups. Notably, Asian adults are significantly less energy burdened than White adults.
Latina and White women are significantly more energy burdened that their men counterparts. Moreover, White women are significantly more burdened than Latino men, and Latina women are significantly more burdened than White men.
Native American adults have among the highest rates of energy burden, although small sample sizes limit in-depth analyses. Black women and Native American adults have similarly high rates and are more likely to live in households with unaffordable energy costs than any other group analyzed.
Table 1: Energy burdened adults, by gender and race/ethnicity, California

Data on adults identifying as Native American, Pacific Islander, Multiracial, or Other Race is insufficient to report. Source: Gender Equity Policy Institute analysis of ACS 2023.
Women 65+ more energy burdened than younger women and men
Seniors (65+) face unaffordable home energy costs at higher rates than other adults, and senior women are disproportionately energy burdened compared to their men peers.
Black women age 65+ have the highest level of energy burden among seniors: 40%. This is 20 percentage points higher than that of senior Asian women and 10 points higher than that of senior White and Latina women.
Within most race and ethnicity groups, senior women experience significantly higher levels of energy burden than their men counterparts. Senior Black women and men have the largest gap, at 8 points. Among Latino and White seniors, women’s energy burden is 5 points higher than men’s. There is no significant gender gap between Asian seniors. There is insufficient data on Pacific Islander and Native American seniors.
Table 2: Energy burdened adults 65+, by gender and race/ethnicity, California

All gender differences within race/ethnicity groups are statistically significant, unless denoted by †. Source: Gender Equity Policy Institute analysis of ACS 2023.
Households headed by women disproportionately energy burdened
Women-led households are the second most common type of household in California, comprising 1 in 4 households and 20% of the state’s population.
Women-led households are more likely to be spending an unaffordable share of income on energy costs than those led by men or by married or cohabiting couples. Families headed by single mothers face some of the greatest energy affordability challenges in the state.
Table 3: Energy Burdened Households, by Household Type, California 2023

Source: Gender Equity Policy Institute Analysis of ACS 2023
Methodology
Gender Equity Policy Institute analyzed U.S. Census, American Community Survey (ACS) 2023 household and individual level data accessed through IPUMS USA, University of Minnesota, www.ipums.org to estimate the share of energy-burdened adults in California.
People are considered energy burdened if more than 6% of household income goes toward energy expenses. GEPI used ACS variables on annual electricity costs, annual gas costs, and, where applicable, home heating fuel costs to calculate each household’s annual energy expenditures. Households that reported utility costs included in rent were excluded from the analysis.
Households and adult household members were classified as energy burdened if energy burden exceeded 6%.
GEPI estimated the share of adults living in energy burdened households by income levels based on California’s median household income. To minimize outliers GEPI considered only households with incomes higher than 0 and excluded households with income in the bottom and top 1%. State income quartiles are:
- Q1 (.25) = $2,500 – $49,600
- Q2 (.50) = >49,600 – $95,200
- Q3 (.75) = >95,500 – $167,000
- Q4 (1) = >167,000 – $741,600
All analyses were stratified by gender and race/ethnicity. Individuals categorized as Latino can be of any race, and all other groups are non-Latino. ACS identifies twelve categories of households, which GEPI categorized into three primary groups: married or cohabiting households, women-led households, and men-led households. Disaggregated analysis was also conducted for single-parent households.
To assess disparities in energy burden across gender, race/ethnicity, parenthood, and household type, GEPI conducted a series of design-based t-tests and survey-weighted logistic regression models. All models were estimated using survey weights to account for the complex sampling design of the ACS.
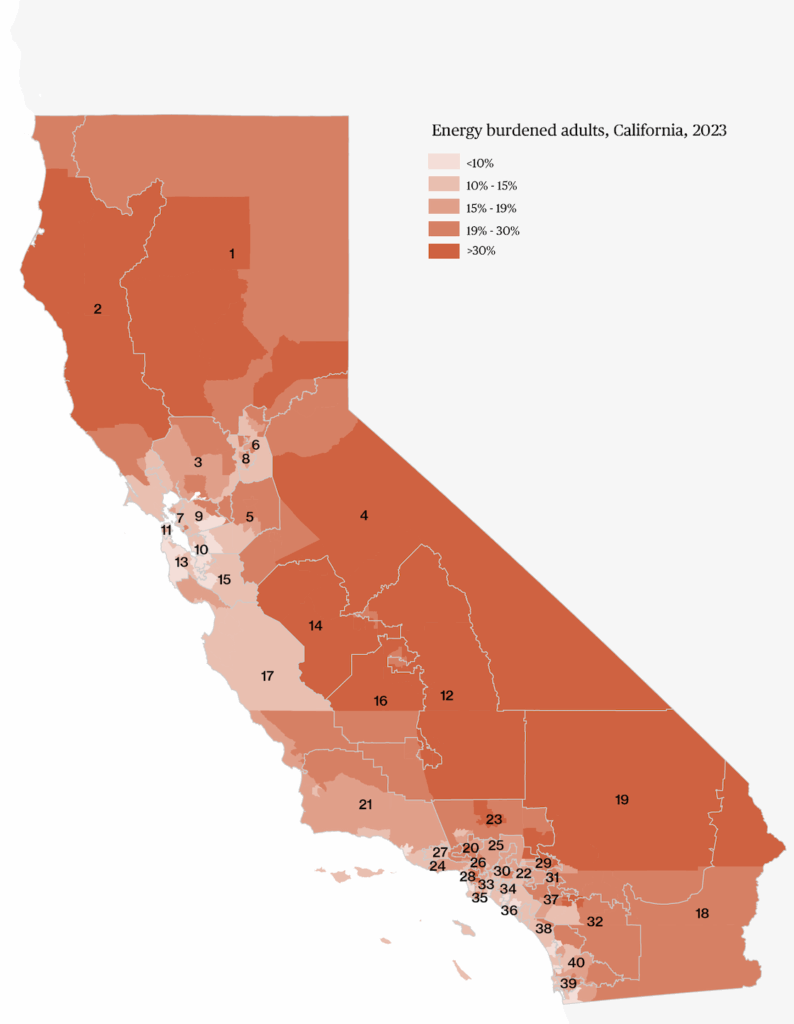
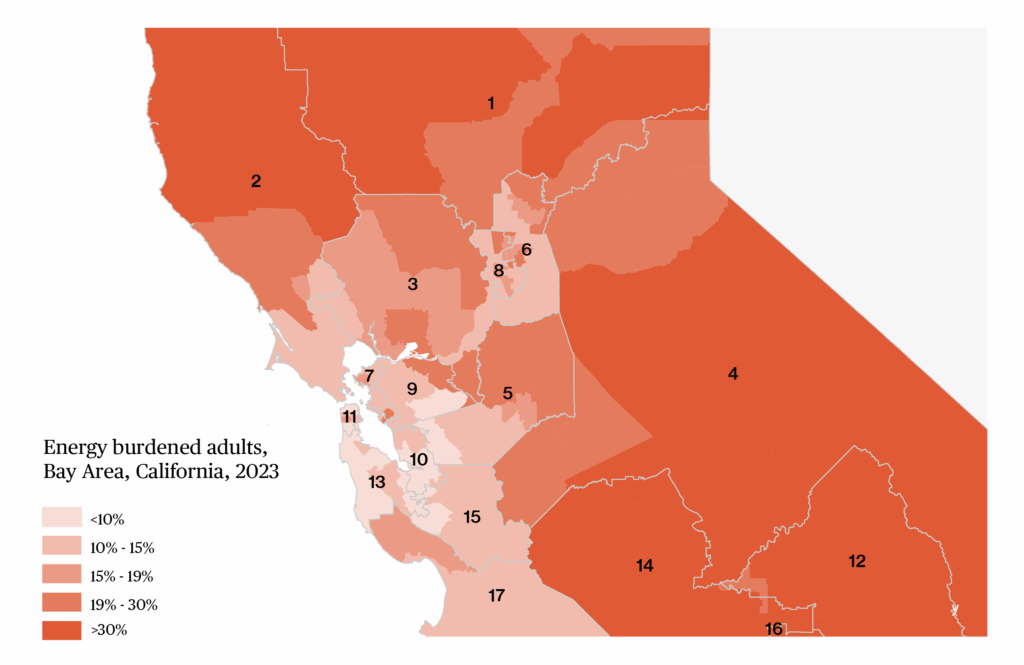
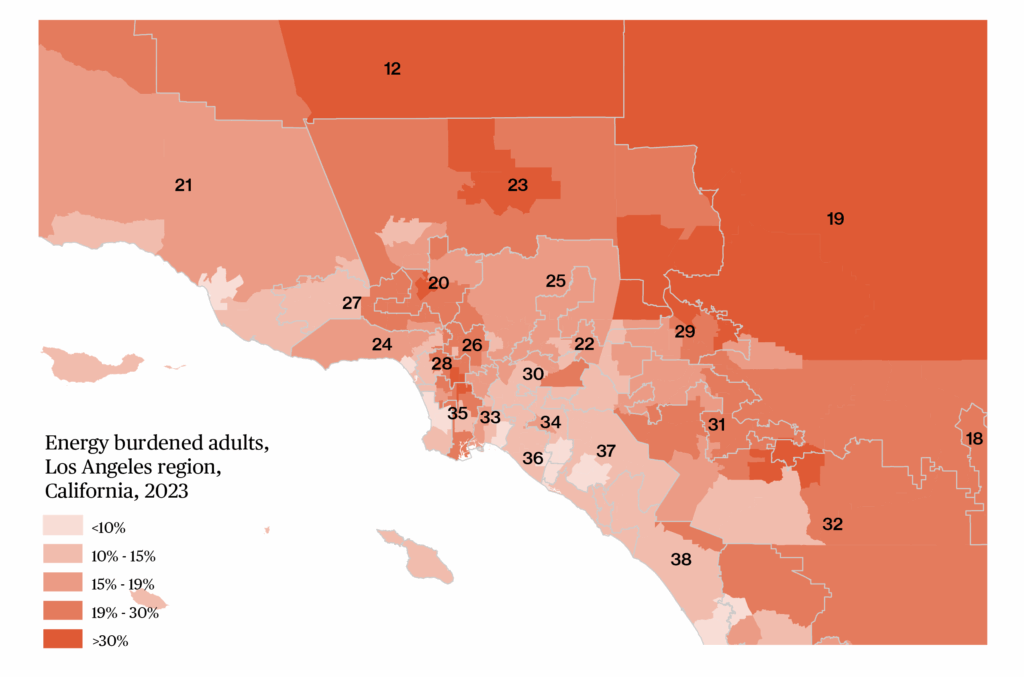
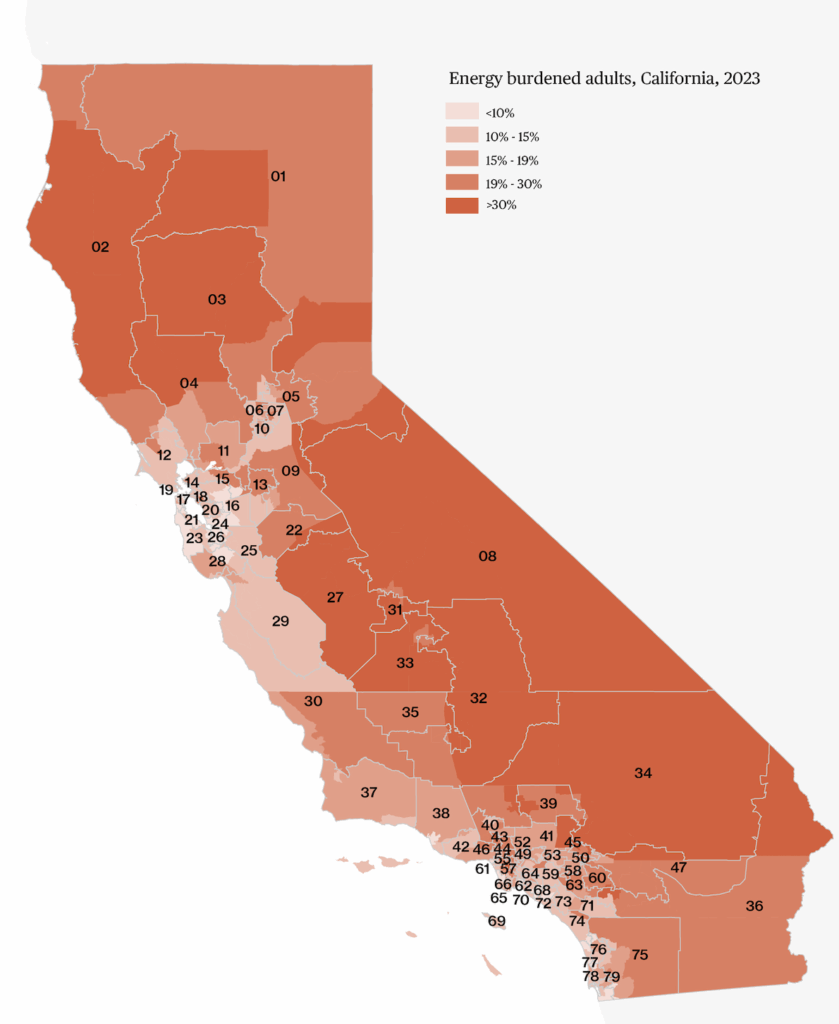
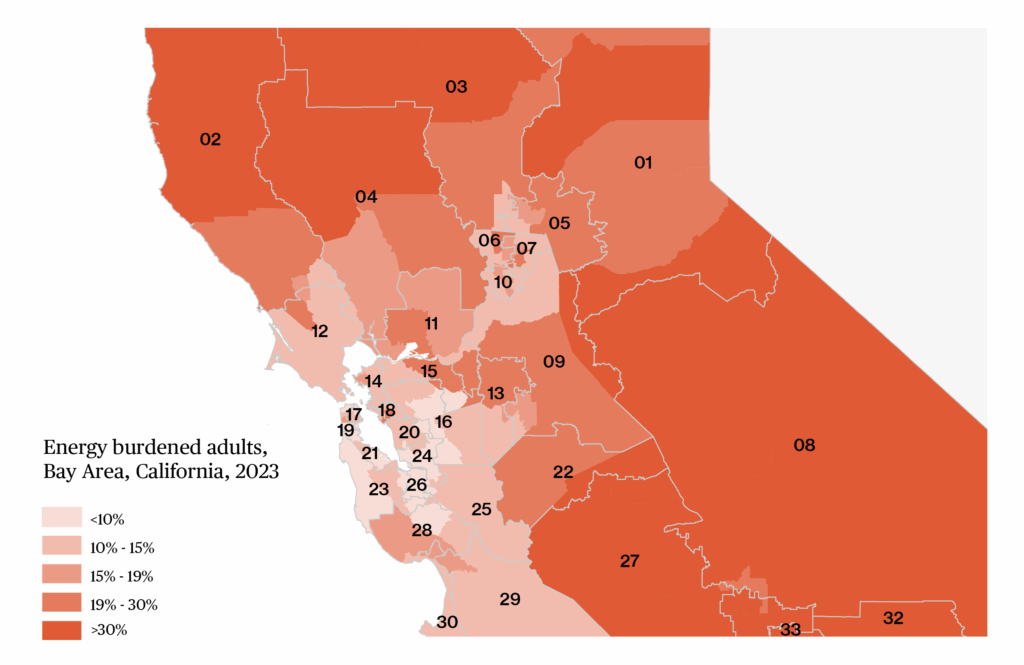
Appendix: Energy Burden, by California Legislative District
The map below shows the share of energy burdened adults by Legislative District and Public Use Microdata Areas (PUMAs). PUMAs are the smallest geographic units available in Public Use Microdata Samples; each contains a population of at least 100,000 adults and children. Black lines show District borders. Source: Gender Equity Policy Institute analysis of ACS 2023 and California State Senate and Assembly District maps accessed at California Energy Commission GIS Open Data.
Share of energy burdened adults by California Senate District
Share of energy burdened adults by California Assembly District

About Gender Equity Policy Institute
Gender Equity Policy Institute (GEPI) is a nonprofit organization dedicated to accelerating gender equality in the United States through data-driven applied research, strategic advocacy, and policy development. Our mission is to rebalance systems, guarantee equal benefits and opportunities, and secure a just and sustainable future for all people.
Recommended Citation
“Data Brief: High Home Energy Costs Hit Women Hardest.” Gender Equity Policy Institute. August 2025. https://thegepi.org/high-home-energy-costs-hit-women-hardest-data-brief/
Contact Information
For media inquiries: [email protected]
To reach the authors: [email protected]
Statement of Research Independence
Gender Equity Policy Institute is a nonpartisan 501c3 organization. The Institute conducts independent, empirical, objective research that is guided by best practices in social science research. The Institute solicits and accepts funding only for activities that are consistent with our mission. No funder shall determine research findings, conclusions, or recommendations made by the Institute. Gender Equity Policy Institute is solely responsible for the content of this report.