
Introduction
For too long, for too many Californians, housing has been too expensive. Currently, a majority of California renters are paying an unaffordable share (more than 30 percent) of their income on rent and utilities. Statewide, one in four renters spends more than half their income on rent and utilities. The number of California residents who are unhoused is at a record high, with the latest federal estimate putting the number at 181,000.1
Californians have become accustomed to the state’s housing affordability crisis. Perhaps too accustomed. It wasn’t always this way.
In 1970, when the California Dream was still in reach for many, more than half of households (55%) owned their own homes. Among those who rented, two-thirds lived in affordable homes.2
This environment of widespread housing affordability began to change during the 1970s. Although the homeownership rate overall remained stable, the share of California renters paying an unaffordable percentage of income on rent and utilities soared.
(By standard measures, people are considered “rent burdened” or “cost burdened” if they spend more than 30 percent of household income on housing costs and “severely rent burdened” or “severely cost burdened” if they spend more than 50 percent of household income on housing costs. For renters, costs include rent and utilities.)
Key Findings
- The share of California renting households spending an unaffordable share of income on housing has increased 55% since 19703
- Compared to 1970, nearly 4 times as many Californians live in renting households spending more than half their income on housing4
- Nearly 7 in 10 women-led households spend an unaffordable share of income on rent5
- Black homeownership has decreased 9% since 19706
- White householders are 1.8 times as likely as Black householders to own their homes7
Women-led households remain 22% less likely to be homeowners, compared to households overall8
- Black households experience the highest levels of rent burden (65%) and severe rent burden (39%)9
California’s current housing affordability crisis has been long in the making, as the analysis in this report demonstrates.
By 1990, nearly half of renting households were rent burdened. In 2010, in the depths of the Great Recession, 58 percent of renting households were rent burdened, and 31 percent were severely rent burdened. Levels of rent burden and severe rent burden remained elevated through the 2010s. National studies and our own analysis of California data have found that rent burdens increased over the course of the COVID-19 pandemic and continued to rise after.10
Gender Equity Policy Institute’s analysis of the most recent U.S. Census data finds that 56 percent of California renting households are rent burdened, an increase of 55 percent since 1970. Additionally, 30 percent are severely rent burdened, a 65 percent increase over the same period.
That translates to 8.1 million Californian men, women, and children living in rentals spending an unaffordable share of income on housing—or roughly 6 million more Californians than faced this situation in 1970.
To put this in perspective, the number of Californians living in unaffordable rental housing is greater than the entire population of Washington State.
Figure 1: Rent Burdened Households, California, 1970 – 2022
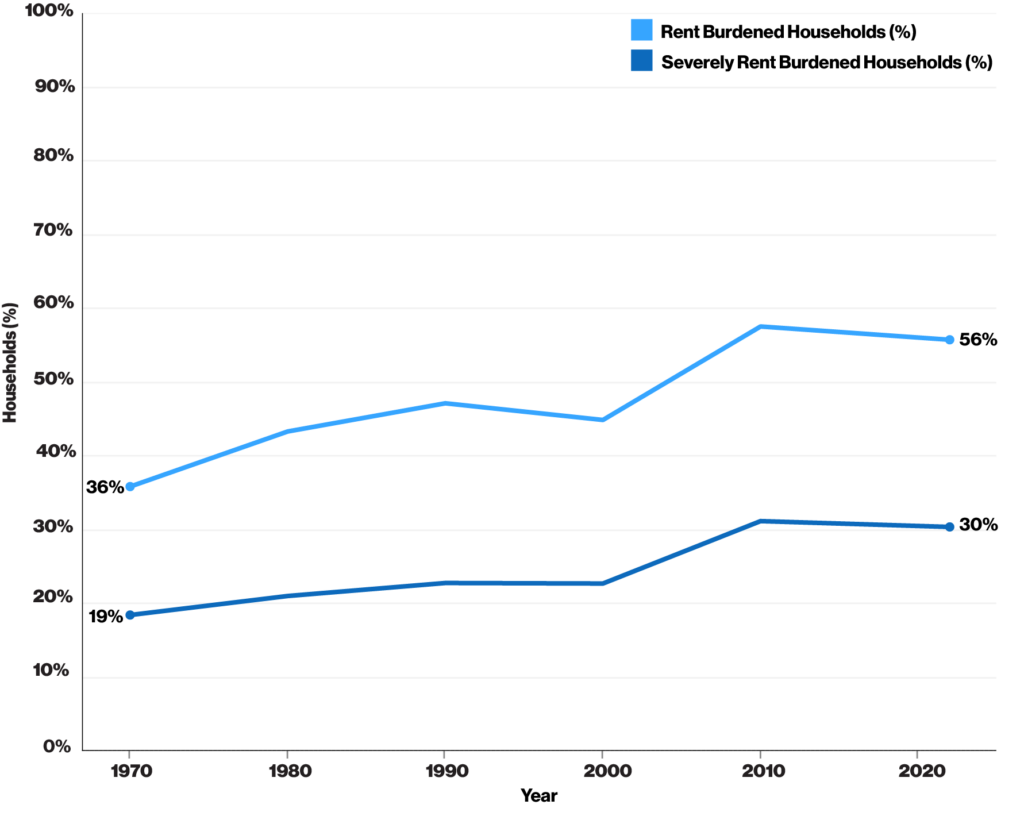
Note: Percentage of California households in rental housing experiencing rent burden and severe rent burden.
Source: Gender Equity Policy Institute analysis of U.S. Census Bureau, 1970–1990, and American Community Survey (ACS), 2000 – 2022.
Race and Gender Inequalities in Homeownership and Affordable Rental Housing
The United States experienced unprecedented economic growth after World War II. During the boom from the late 1940s through the 1960s, many California families could own their homes or live in affordable rentals. An abundant supply of homes affordable to middle- and working-class families was a pillar of the California Dream.
Over the last fifty years, homeownership rates in California have stayed relatively constant. But this image of stability is deceptive, masking stark differences across race and ethnicity and gender that have persisted over time.
Figure 2: Homeownership, by Race/Ethnicity, California, 1970 – 2022
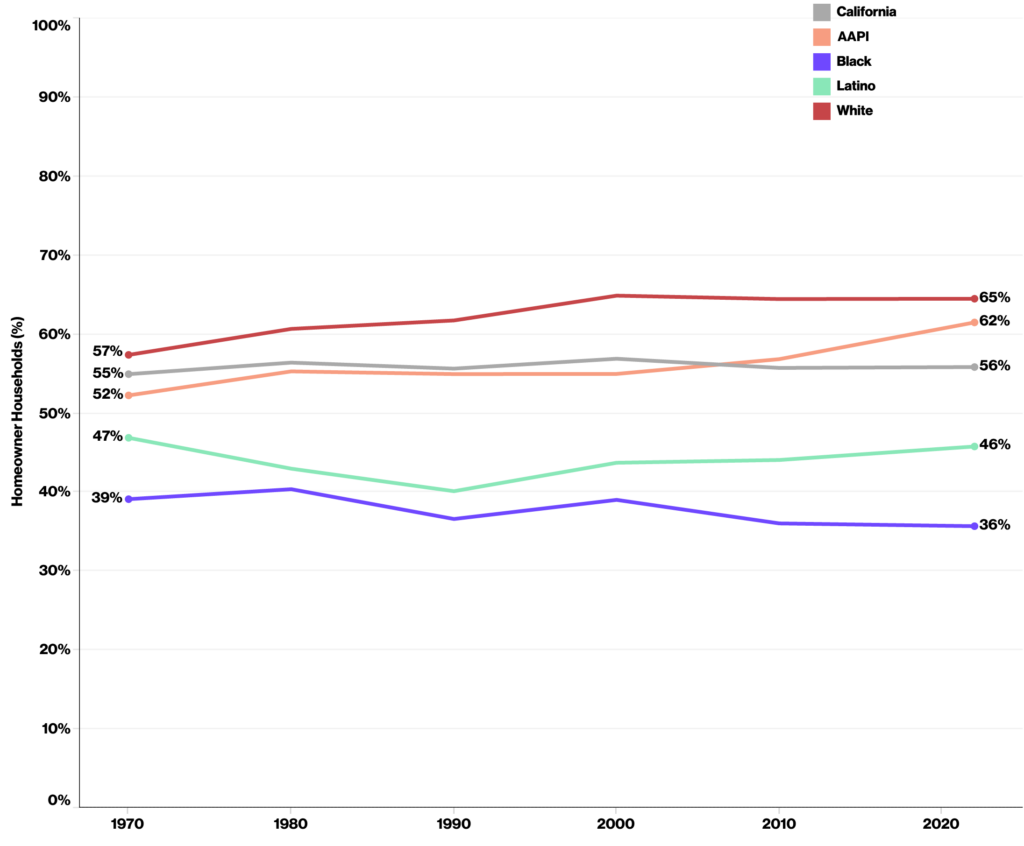
Note: Percentage of California households that own their home, by race/ethnicity.
Source: Gender Equity Policy Institute analysis of U.S. Census Bureau, 1970–1990, and American Community Survey (ACS), 2000 – 2022.
Among some groups, homeownership has increased substantially. Roughly two in three Asian American/Pacific Islander (AAPI) and White families are homeowners. Between 1970 and 2022, homeownership rates increased 18 percent among AAPI families and 12 percent among White families.
In 1970, Black families had the lowest homeownership rate among race and ethnicity groups. Over the last half century, Black homeownership decreased by 9 percent. Only one in three Black families are homeowners.11
Homeownership among Latinos has fluctuated but is flat over the period as a whole. Less than half of Latino families are homeowners.
Currently, White householders are 1.8 times as likely as Black householders and 1.4 times as likely as Latino householders to own their homes.
Gender disparities are also stark. In 1970, households led by women had a homeownership rate 31 percent below the California average. Fewer than four in ten owned their own homes.
Since 1970, homeownership rates have increased significantly among women-led households. But they remain far below those of White and AAPI householders and about the same as those of Latino householders.
Figure 3: Homeownership, by Gender, California, 1970 – 2022
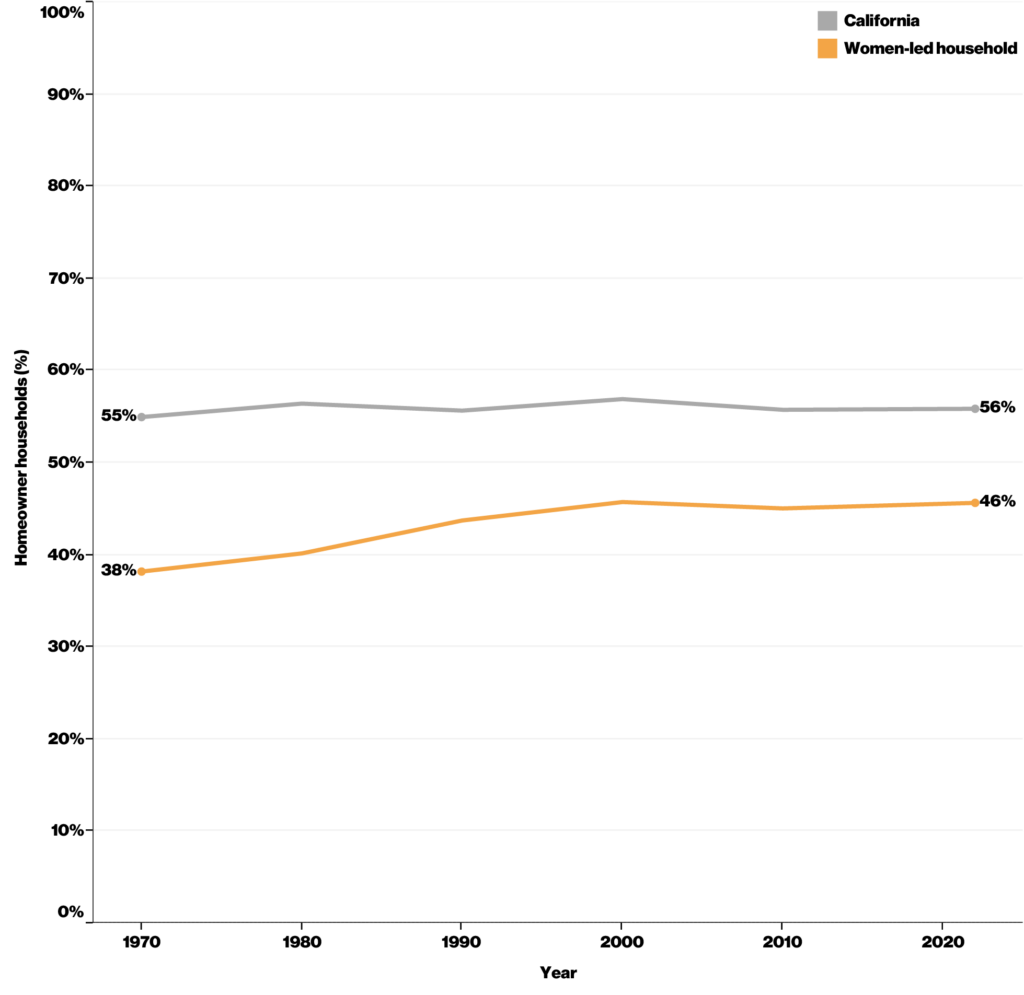
Note: Percentage of California households that own their home, by gender. See methodology for definitions of household types.
Source: Gender Equity Policy Institute analysis of U.S. Census Bureau, 1970–1990, and American Community Survey (ACS), 2000 – 2022.
Compared to other race and ethnicity groups, Black households experience the highest levels of rent burden (65%) and severe rent burden (39%); Black women and children are the most likely to be living in renting households spending more than 50 percent of family income on housing. 12AAPI households experience the lowest rent and severe rent burdens, at 49 percent and 28 percent respectively.
Figure 4: Rent Burdened Households, by Race/Ethnicity, California, 1970 – 2022
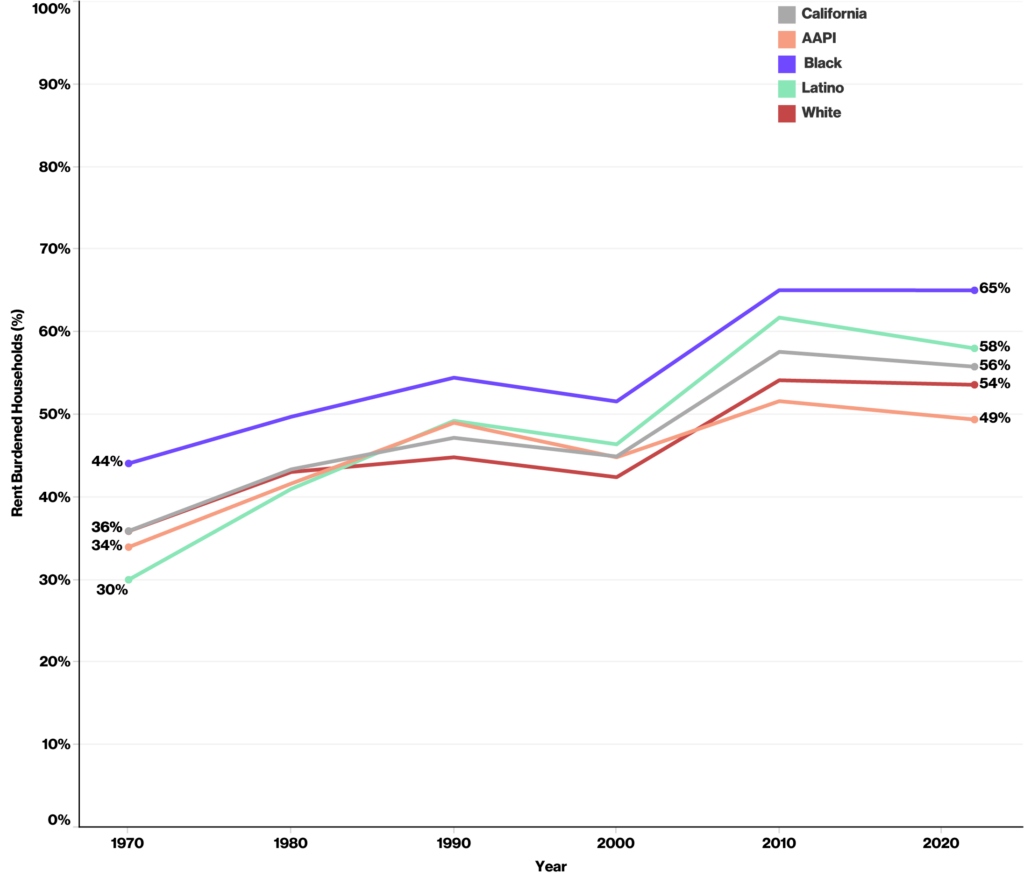
Note: Percentage of California households in rental housing experiencing rent burden and severe rent burden, by race/ethnicity.
Source: Gender Equity Policy Institute analysis of U.S. Census Bureau, 1970–1990, and American Community Survey (ACS), 2000 - 2022.
Women-led households experience the highest level of rent and severe rent burden of California households overall.
In 1970, six in ten spent more than 30 percent of their income on rent and utilities, making them 1.6 times as likely as California households overall to be rent burdened.13
Even as all race and ethnicity groups have experienced significant increases in rent burdens, women-led households continue to have the highest levels of rent and severe rent burden. This has been the case in every decade since 1970. Over the five decades since 1970, the share of rent burdened women-led households has increased to 68 percent. Four in ten women-led households (42%) are severely rent burdened.
Compared to every major race and ethnicity group, women overall have the highest share of rent burden and severe rent burden. Likewise, within every major race/ethnicity group, there is a gender gap in rent burden, with women experiencing rates three to six percentage points higher than their male counterparts.
GEPI’s detailed interacted analyses of California data from the years 2019, 2021, and 2022 have found that, by every measure, women are consistently more likely than men to be living in homes spending an unaffordable share of income on housing.14
Figure 5: Rent Burdened Households, by Gender, California, 1970 - 2022
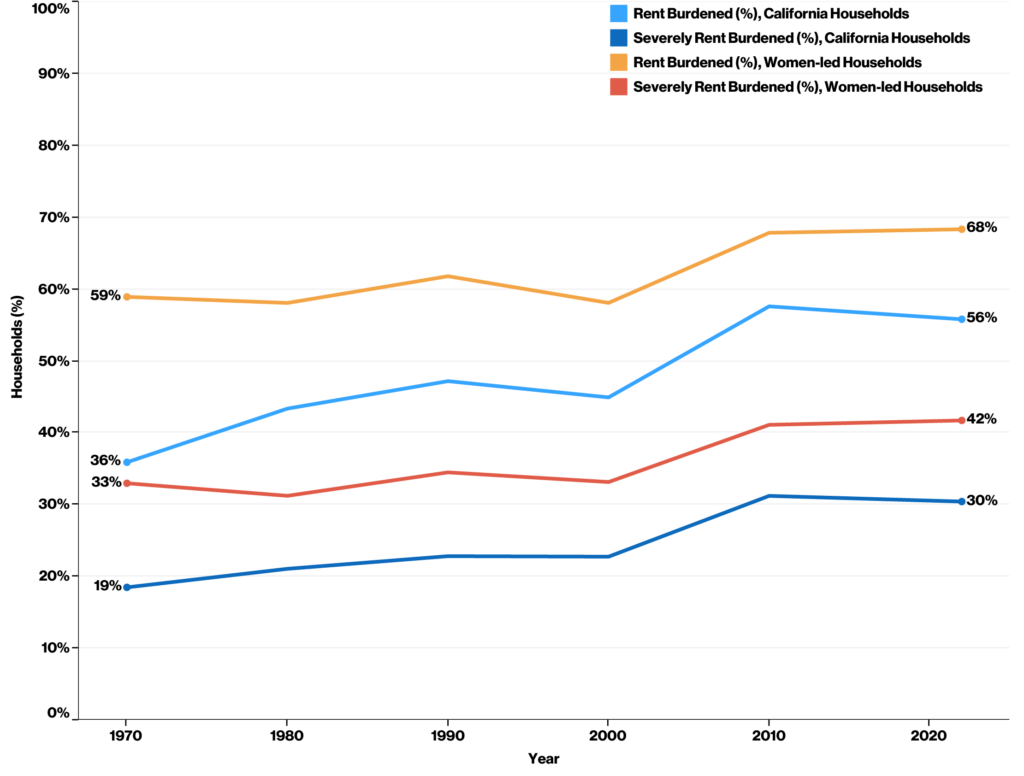
Note: Percentage of California households and California women-led households in rental housing experiencing rent burden and severe rent burden.
Source: Gender Equity Policy Institute analysis of U.S. Census Bureau, 1970–1990, and American Community Survey (ACS), 2000 - 2022.
Conclusion
There is a robust and sometimes contentious debate underway in California about the best approach to solving the state’s housing crises. What is not under debate—at least by anyone serious about creating a resilient, equitable, and economically vibrant California—is that the state’s homelessness and affordable housing crises are a drag on the economy and negatively affect nearly every person, business, and institution in the Golden State.
As California policymakers continue to tackle this complex challenge, they should aim to expand the California Dream, not simply to restore it. Because that Twentieth Century ideal was always largely out of reach for Black families and those headed by women.
As we have seen, Black Californians largely missed out on the homeownership boom of the postwar era, with multigenerational consequences. A robust research literature on the various mechanisms of racial discrimination in housing– redlining, predatory lending practices, government policies, and the like—has documented the harms experienced by Black families.15 GEPI’s analysis of California data is consistent with the findings of this scholarship. More than fifty years after Fair Housing laws sought to end racism in the housing market, the Black homeownership rate in California has fallen and stands at a level significantly below the rates for White and Asian American Pacific Islander households.
Just as racial discrimination in the housing market undermined opportunity for Californians, so too did sex discrimination shape California’s current affordability crisis, in which women are more likely than men to struggle to pay for rental housing and have lower homeownership rates.16
Throughout the postwar economic boom, American women did not have the right to apply for mortgage loans or credit cards on their own without a male co-signer. The 1974 Equal Credit Opportunity Act made these discriminatory practices illegal. But by this time, the nation was in a recession, inflation had spiked, and changes in the housing market were already underway. Left out of the postwar economic boom by discriminatory laws and burdened by gender pay gaps, women entered a more expensive housing market from a disadvantaged position. As housing prices and rents rose from the seventies onward, the burden of rising costs continued to fall more heavily on women, especially those facing intersecting forms of discrimination.
The data provided in this report on homeownership and the sharp rise in rental costs over the last fifty years is compelling evidence that action is needed. Future reports by Gender Equity Policy Institute will explore policy solutions, with particular attention given to tackling gender and racial disparities in housing.
It is encouraging to see the current administration and legislature taking a broad range of actions to both spur the development of housing and protect vulnerable and low-income Californians in their existing homes. The historical perspective provided here underscores the magnitude of the crisis and can serve also to show that change is possible.
Methodology
The Gender Equity Policy Institute analyzed U.S. Census Bureau 1970 – 1990 household data and American Community Survey (ACS) 2000 – 2022 household data accessed through IPUMS USA, University of Minnesota, www.ipums.org. All analyses were stratified by gender and race/ethnicity.
Household classification
For this analysis GEPI used HHTYPE variable, an IPUMS constructed variable that mirrors the household type variable created by the Census Bureau in its 2000 PUMS sample. This variable classifies households as non-family and family households, by using marital status, sex, and relationship to the head of household. Thus, family households are classified as either a married-couple family or a family headed by a man or woman without a spouse present. Non-family households are classified by the sex of the household head and the presence of other unrelated individuals (including partners) living in the household. In total, HHTYPE identified seven categories of households, which GEPI grouped into three main groups: married households, women-led households, and men-led households.
The household classification described above differs from that in GEPI’s previous reports reporting housing data. In these reports, CBHHTYPE was employed for household classification; CBHHTYPE specifically identifies cohabitating couple households, single mothers, single fathers, and others. But CBHHTYPE variable is not available in IPUMS for the 1970-2010 samples. To address this limitation in the earlier data and enable a comprehensive trend analysis, we opted to use the HHTYPE variable for this report. It is important to note that this creates a discrepancy between the household data reported herein and that reported in Data Brief: Women and Housing in California, 2024.
Race/ethnicity
For this analysis, GEPI used IPUMS’s variable called RACE. This variable provides the full detail given by the respondent and/or released by the Census Bureau around race/ethnicity. This decision allowed us to have a comprehensive trend analysis from 1970 – 2022.
Using this variable, GEPI conducted a mutually exclusive categorization using this variable which includes the following race/ethnicity groups: Asian American and Pacific Islanders (AAPI), Black, Latino regardless of other race, Non-Latino White, Non-Latino Native American, and Other race. Native Americans (non-Latino) and Other race were not reported here due to small samples. It is worth noting that similar to household categorization, this race categorization might result in a discrepancy between the household data reported herein and that in the Data Brief: Women and Housing in California, 2024.
Housing Affordability
In this report and all previous GEPI reports covering housing, we assessed housing affordability for renters by calculating the number and proportion of households living in rentals that are rent burdened. A household is considered rent burdened when it spends more than 30% of its household income on gross rent, which includes contract rent, utilities (water, electricity, gas) and fuels (oil, coal, kerosene, wood, etc.). A household is deemed severely rent burdened when more than 50% of its household income is spent on gross rent.
For 1970, rent burden and severe rent burden calculations were based on family total income as household income was not available for that year. For the rest of the decades and year 2022, calculations were based on household income.
Citation
Natalia Vega Varela, and Nancy L. Cohen, “The Origins of California’s Housing Crisis: Fifty Years of Rising Rental Housing Costs and Their Unequal Impacts on Californians,” Gender Equity Policy Institute, June 2024. https://doi.org/10.5281/ zenodo.11094192
Contact
For media inquiries, email: press@thegepi.org
To reach the authors, email: research@thegepi.org
Statement of Research Independence
Gender Equity Policy Institute is a nonpartisan 501c3 organization. The Institute conducts independent, empirical, objective research that is guided by best practices in social science research. The Institute solicits and accepts funding only for activities that are consistent with our mission. No funder shall determine research findings, conclusions, or recommendations made by the Institute. Gender Equity Policy Institute retains rights in intellectual property produced during and after the funding period. We provide funders with reproduction and distribution rights for reports they have funded. Gender Equity Policy Institute is solely responsible for the content of this report.