
Executive Summary
Time is a valuable but finite resource—and a rare one that is equally distributed. Young or old, employed or retired, we all have the same 24 hours in each day. How we spend those hours is powerfully shaped by culture, economics, and even public policy—by necessity, not solely by choice.
When Time Isn’t on Your Side: Unpaid Work and the Free-Time Gender Gap in California examines how California adults divide their time between work, unpaid childcare and household work, free time, and all other activities. Analyzing American Time Use Survey (ATUS) data from 2021 through 2024, we find that women spend significantly more time than men taking care of children and doing housework like cooking, cleaning, and grocery shopping. Moreover, women in California spend more time on work than men, once unpaid childcare and household work in the home is added to the time spent in paid employment.1
This imbalance in the division of unpaid labor in the home shapes how the remaining time can be spent, contributing to the free-time gender gap, a topic Gender Equity Policy Institute explored in our October 2024 report on U.S. adults overall.
These gender disparities are not simply the result of personal choice or individual family dynamics. How women and men spend time is influenced by deeply entrenched cultural norms and stereotypes about women’s role in society. The notion that women’s place is in the home persists despite profound changes in public opinion on gender and decades of progress toward gender parity in education, public life, the workplace, and other spheres.
Let us be clear. Household labor is necessary for health, well-being, and survival. Children must be cared for. Parenting is meaningful and often full of joy. Domestic labor, whether unpaid or paid, is enormously valuable. Without it, society would quite literally grind to a halt.
The problem is not the act of doing housework or childcare. The problem is that longstanding cultural norms systematically devalue domestic labor, whether done for free by family members or by people who are paid for their work. And it is devalued precisely because it is historically women’s work.
Public policy, unfortunately, plays an important role in sustaining these gendered patterns of inequality in domestic labor. The United States has a unique culture of overwork; American workers put in far more hours than those in other wealthy countries.2 Compared to other OECD countries, the U.S. invests less in childcare and is the only nation without any form of paid leave. The U.S. has the lowest women’s labor force participation rate of any of its peers, which research has directly linked to the absence of policies to support working families.3
Gender equality in American society will remain elusive until women and men are truly equal in the home. Public policy can help accelerate progress, and California has been a national leader in this regard, as we discuss in the conclusion of this report.
Change will ultimately require cultural shifts in how we value the work of caring for children and homes and the people who do it. Policies designed to support families can nudge along cultural change toward a more balanced, fair, and equitable division of work in the home.
Key Findings
- Women spend twice as much time as men taking care of children
- Mothers put in the equivalent of a full-time job—37 hours—every week on unpaid care and household work
- Mothers have 41% less free time than fathers
- Working mothers do twice as much housework as men on days they work
- Latina women do more unpaid care and household work than any other group. They do more than twice as much of this domestic labor as Latino men.
Unpaid but essential work in the home still treated as women’s work
Taking care of children and household work are highly valuable, even when the work is unpaid. Someone must do the grocery shopping and cooking. If no one in the home has time to do this work, then it must be outsourced—usually at a cost. Young children need supervision and care; parents must pay for childcare if they cannot do it themselves. Unpaid labor in the home is not only essential to survival, it often creates the conditions that free up the time of another family member to work.4
People who are married or live with a partner report greater satisfaction when both contribute equally to household chores.5 Most people say that men and women are equally good at parenting.6 Despite these egalitarian ideals, women do significantly more of this work than men across all groups, by race and ethnicity, family structure, and employment status. Even in families with the highest levels of income, who could most easily afford to outsource these services, women do more than men. In fact, once women’s likelihood of working outside the home is accounted for, there is no meaningful variation in the number of hours women with different family incomes devote to caring for home and family. At all income levels, women do more than their male counterparts.
Women spend 64% more time than men on childcare and household work combined. Over the course of the average week, this adds up to women spending nearly 10 more hours than men cooking, cleaning, and caring for children. The work of maintaining a home includes everything from making daily meals to less frequent chores like mowing the lawn. Not only do women spend more time than men on these combined tasks, but women also do them more frequently than men.
The largest gender difference in household work is between Latinos, with women spending more than twice as many hours as men. When childcare and household work are combined, Latinas spend more time than any other group, and they devote more than double the time to it as Latino men. The differences between men and women in other race/ethnicity groups are smaller, but still statistically significant. White women spend 35% more time than White men on household work, and Asian and Pacific Islander (API) women spend 31% more time than API men. Unfortunately, small sample sizes make it difficult to explore time spent on unpaid childcare and household work for Black women and men and prevent analysis for many other racial and ethnic groups, including Native Americans and multiracial people.
Women, regardless of parental status, spend significantly more time than men caring for children.7 Every day in California, one in four women and one in six men provide care to children, and women spend nearly twice as much time as men doing it.
Mothers spend more time than fathers caring for home and family
All families are different, but there are strong gendered patterns to who does the housework and takes care of children.
In total, mothers spend nearly twice as much time as fathers on childcare and household work—more than 17 extra hours per week.
The large majority of parents in California work. Working parents naturally have less time to devote to childcare and household work, but working mothers still put in 63% more time than working fathers on unpaid childcare and household work each week.
Among parents, there is a very large gender imbalance when it comes to cleaning, cooking, and all other work in the home. Overall, mothers spend twice as much time per week on household work as fathers. Nine in ten mothers do it every day, compared to less than three in four fathers. Working mothers still devote 64% more hours towards household work than working fathers, despite all the other demands on their time.
Figure 1: Weekly hours spent on household work by gender, parental status, and employment, California, 2021 – 2024
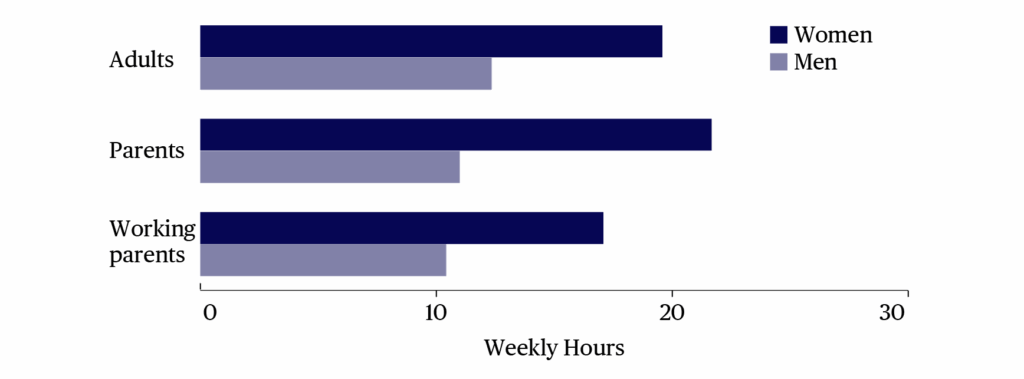
Note: Population includes Californians aged 18 and older. Parents are defined as having at least one child under 18 in the household. Workers are defined as employed and having worked in the preceding week. Average weekly hours include any time spent on household work as a main activity on the time diary day, multiplied by 7. All reported gender gaps are statistically significant. See appendix for methodology and comprehensive description of the tasks included.
Source: Gender Equity Policy Institute analysis of IPUMS ATUS, 2021-2024.
There are even stronger gender imbalances when it comes to taking care of children. Across all families with children under 18, mothers spend 75% more time than fathers on childcare. Mothers are also more likely to do childcare in the first place. Roughly three-quarters of mothers spend focused time caring for children each day, compared to just over half of fathers.
There are legitimate reasons why working parents have less time for childcare. Parents with long commutes, long work hours, or whose work does not align with school schedules can be left with very little time to spend with their children at all. But even after controlling for work hours, there are significant gender disparities in time spent on childcare. Working mothers devote 62% more time each week to caring for children than working fathers.
Figure 2: Weekly hours spent on childcare by gender among all parents and working parents, California, 2021-2024
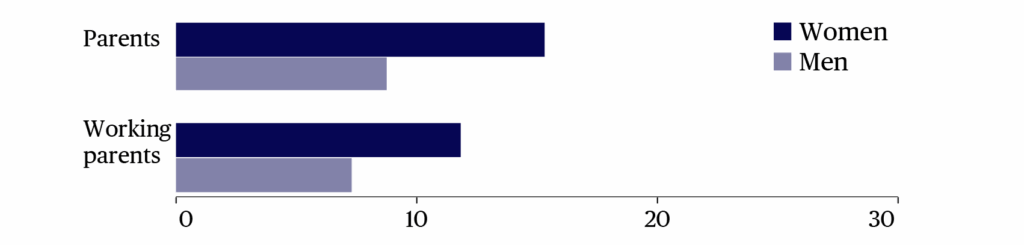
Note: Population includes Californians aged 18 and older. Parents are defined as having at least one child under 18 in the household. Workers are defined as employed and having worked in the preceding week. Average weekly hours include any time spent on childcare as a main activity on the time diary day, multiplied by 7. Time spent on childcare while participating in another activity is not included. All reported gender gaps are statistically significant. See appendix for methodology and comprehensive description of the tasks included.
Source: Gender Equity Policy Institute analysis of IPUMS ATUS, 2021-2024.
One way that family needs can be met in the face of competing demands on time is to combine childcare with other obligations. While people may multitask throughout their day, typically only their main actions are recorded in the American Time Use Survey. Childcare is an exception, and people can record the amount of time they spend caring for children while also focused on doing something else. For example, reading a bedtime story is considered childcare as the primary activity. In contrast, waiting in line at the DMV with a cranky toddler is considered childcare as a secondary activity. (For more information about how time use is categorized, see Methodological Appendix.) Both men and women spend significant amounts of time on childcare as a secondary activity. Still, when comparing time across all forms of childcare, women spend more time than men caring for children.
Working women come home to an unpaid second shift
Most women work outside the home, but the work traditionally done by stay-at-home wives and mothers did not disappear when women entered the labor force in great numbers.
Working women are more likely to come home at the end of the day to the “second shift”—several more hours of unpaid labor cooking, cleaning, and taking care of children.8 All told, the second shift for women on work days is 72% longer than it is for men.9
On work days women put in a significantly longer ‘second shift’ of unpaid household labor and childcare, extending their total working hours compared to men
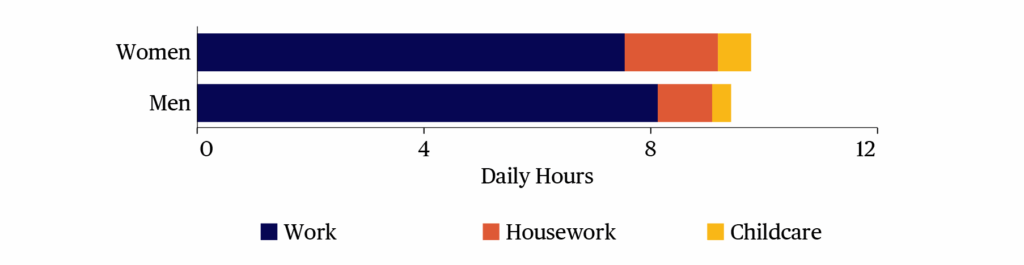
Figure 3: Hours spent on childcare and household work on work days by gender, California, 2021-2024.
Note: Population includes Californians aged 18 and older. Work days are defined as days when time was spent doing the specific tasks required of one’s main or other job, regardless of location, and includes self employed workers. Only time spent on childcare as a main activity is included; time spent on childcare while participating in another activity is excluded. See appendix for methodology and comprehensive description of the tasks included.
Source: Gender Equity Policy Institute analysis of IPUMS ATUS, 2021-2024.
Although people in paid employment naturally have less time to do other things, significant gender differences in unpaid work in the home persist—particularly among parents. On days fathers work, they are among the least likely to do household chores of any group measured in this report. In contrast, on work days mothers are significantly more likely than women overall to spend time on housework.
Among employed parents, mothers spend 81% more time than fathers on household chores and responsibilities on work days. Childcare adds even more time to working mothers’ second shift; these mothers devote 62% more time to taking care of children than working fathers.
In other words, while men on average spend more time at their jobs than women, men do not work more than women. When time spent on paid work is combined with the time devoted to the unpaid second shift, women do more work than men.
The free-time gender gap
Taking care of all the things that one must do frequently means that there is not as much time left for the things that one wants to do. Free time—to see friends, exercise, or just unwind—is often the first thing to be scaled back when time is short.
Once all of the myriad time demands are met, women are left with significantly fewer hours of free time than men. Across every group analyzed, women have less time than men to spend as they choose and pursue their personal interests. Overall, women have 18% less free time than men. That’s the equivalent of women having an hour less free time, every single day.
Figure 4: Division of day by total time spent on different activities, by gender, California 2021-2024
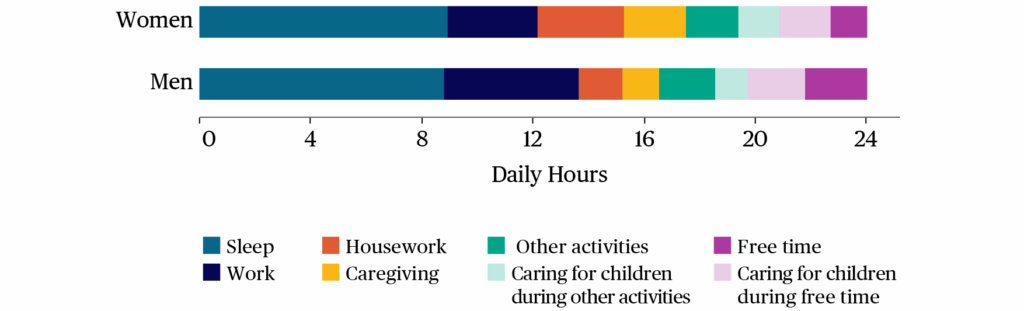
Note: Population includes Californians aged 18 and older. Caregiving includes childcare and care for adults. Caring for children during free time and other activities refers to time spent with at least one child in the individual’s care. See appendix for methodology and comprehensive description of the tasks included.
Source: Gender Equity Policy Institute analysis of IPUMS ATUS, 2021-2024.
Take a few examples of how the free-time gender gap stacks up for different groups of women. Compared to men of their own race or ethnicity, API women have 27% less free time, Latinas have 17% less free time, and White women have 12% less free time. Even among retirees—the group with the most available free time—women still have less than men.10
Counterintuitively, the busier people are, the wider the gender gap. Working women have 20% less free time than working men. Parents naturally have less free time than their peers who aren’t raising children. Yet the gender gap is widest among parents.
How does this happen? True, there are small differences across parents’ time spent on various daily activities, but many largely cancel each other out or aren’t statistically significant. For example, mothers get about 8 more minutes of sleep than fathers, while fathers spend about 10 more minutes eating and drinking than mothers.
The key difference is that mothers’ unpaid labor takes up a significant share of time—and a significantly greater share of time than that of fathers. The extra hours mothers spend caring for children and doing housework show up in fathers’ days as free time. Overall, mothers are left with 27% less free time than fathers.
But that’s not all. The real disparity is far larger. During the time parents report as free time, mothers are also more likely than fathers to be taking care of children simultaneously.11
Certainly, parents enjoy spending time with their children and derive meaning and purpose from parenting. But the research is clear on how much stress parents in America feel.12 Even if one enjoys their time taking care of kids, it is not the same as having time truly free to socialize, relax, or recharge. It is not the same as when one has time to do what one wishes without worrying about someone else. Once all time spent on childcare is factored in, mothers are left with 41% less free time than fathers.
Public policy can support culture shifts
The sense of being overloaded and stretched too thin is a common feeling. Almost two-thirds of all adults say that work is a significant source of stress; more than half say family responsibilities are.13 Americans are more likely than those in peer countries to say that work conflicts with their family responsibilities. The stress this causes is linked to negative health effects including depression, anxiety, and cardiometabolic risk. It is a contributor to rising healthcare costs. It is even a predictor of mortality.14
Most women work, as do men. But women spend more of their time doing the childcare and household work that sustains families and homes. There are only 24 hours in each day. Given the time-consuming nature of women’s responsibilities in the home, it is inevitable that many women will feel stressed and burdened by having too much to do and not enough time to do it.
The U.S. is an outlier on nearly every policy that could help support working parents. The average share of GDP spent on early childhood education and care is much lower than the OECD average.15 Since the U.S. does not make meaningful investments to help offset the cost of providing care, families in the United States pay more out of pocket than those in other countries—even when the underlying childcare fees are similarly high.16
Childcare prices in California are the fourth highest in the nation; they are higher only in Massachusetts, Hawaii, and New York.17 In 2023 the median price of center-based care for an infant in California was $20,000, and prices were even higher in more than a third of counties.18 For the average single mother heading a household, that is equivalent to 44% of her total family income for the year.19
The extremely high price of childcare makes it difficult for mothers to work and is a significant factor in women’s lower labor force participation rates and higher rates of part-time work relative to men.20 Women’s greater involvement in family caregiving can feed into a vicious cycle. If someone has to leave their job to care for children, it is typically the family member whose wages are the lowest—and that person is more likely to be a woman. And women’s wages are lower, in part, because of differences in employment that are influenced by caregiving. Sometimes this is the result of current and very real demands on women’s time, like when mothers cut back their work hours and miss out on potential promotions because of childcare needs. But it can also take more subtle forms that can present as a ‘choice.’ There is research showing that some women leave higher-paying degree programs or jobs, due to the perception that these career paths could conflict with family responsibilities.21
When women reduce their work hours or stop working to provide unpaid care at home, it may be a rational economic decision in the short-term. That decision may not feel like a choice at all, especially to lower income families. Nevertheless, there are long-term economic consequences to women taking on most of the unpaid care work within families. Research from the U.S. Department of Labor Women’s Bureau and the Urban Institute found that the lifetime earnings of mothers are reduced by 15% because of unpaid family caregiving, a cost amounting to over $350,000 when inflation adjusted to 2025 dollars.22
Women are not naturally better at caring for children than men, but the gendered norms around care result in a greater likelihood that they will develop more childcare skills over their lifetimes. As children, girls are more likely than boys to be given dolls to play with, to care for their younger siblings, and to babysit as teenagers. For many men, the first time they take care of a baby is when they become fathers. Ensuring that men have opportunities to learn and become comfortable caring for children is an important aspect of gender equity.
California was the first state to enact a paid family leave system, which has subsequently served as a nationwide model. Importantly, it applied to all parents—men and women, birthing and adopting—not just mothers who gave birth themselves. In the first eight years of the program, gender-neutral paid leave increased the rate at which fathers took parental leave by close to 50%. These rates have continued to increase over time.23 In a local California case, San Francisco’s ordinance increasing wage replacement for workers on parental leave, there was a much stronger increase in leave-taking among fathers than mothers.24 The state recently enacted increases to wage replacement for low-wage leave-takers.25 While it is too soon to measure the impact, such a policy change may have a similar effect on fathers across the state.
Men’s ability to take meaningful parental leave is associated with more frequent and engaged caretaking of their babies, and these effects persist as their children grow up.26 Parents also need other policies to help shift workplace norms so that work is more compatible with childcare responsibilities. For example, a state bill introduced in 2022 by Assemblymember Buffy Wicks would have prohibited employment discrimination based on family responsibilities, similar to employment protections in place in six states and D.C.27
Babies are not the only family members who need care, and policies to support caregivers across the age spectrum have significant gendered implications. Most unpaid eldercare providers are women, and one in five are also parents caring for their own children.28 In California about 15% of paid family leave claims are to care for family members experiencing a serious illness.29 Unlike many other states, the program currently only covers caretaking for a limited list of family members.30 A recently passed bill authored by Senator María Elena Durazo expands coverage to include chosen or extended family, an important source of support for LGBTQ people and people living in multigenerational households.31 This will be especially beneficial to women, who are more likely than men to care for an older friend, neighbor, or loved one other than a legal relative.32
The problem isn’t only that women do more of the housework and spend more time taking care of children, or that they have less free time to enjoy. It’s that these patterns play out because household labor and childcare are deemed “women’s work” and undervalued. This work is vital to the functioning of society: care is critical economic infrastructure.
Although views and practices on gender roles have evolved substantially in recent decades, a subtle economic and cultural push-pull remains at play. Women are pushed to the sidelines in workplaces and the halls of power by policies that are rooted in outdated notions of who belongs—someone who looks a lot like a man with a stay-at-home wife. And at the same time, women are being pulled back into the home by the demands of family and household needs, which are nearly impossible to meet under current conditions.
The outdated but persistent gender norms that lead to women’s greater family and household responsibilities must be addressed. The result won’t just be that women gain the same amount of time to unwind and enjoy their favorite pastimes like men, although that is a laudable goal in itself. An equitable division of labor within households and families is also an important and necessary component of building a more equitable future for all people, women included.
Methodology & Appendix
See Methodology and Appendix here.
About Gender Equity Policy Institute
Gender Equity Policy Institute (GEPI) is a nonprofit organization dedicated to accelerating gender equality in the United States through data-driven applied research, strategic advocacy, and policy development. Our mission is to rebalance systems, guarantee equal benefits and opportunities, and secure a just and sustainable future for all people.
Recommended Citation
Sarah Jane Glynn, Natalia Vega Varela, and Nancy L. Cohen, “When Time Isn’t on Your Side: Unpaid Work and the Free-Time Gender Gap in California” Gender Equity Policy Institute, October 2025. https://doi.org/10.5281/zenodo.17252685
Contact Information
For media inquiries: [email protected] | [email protected]
To reach the authors: [email protected]
Statement of Research Independence
Gender Equity Policy Institute is a nonpartisan 501c3 organization. The Institute conducts independent, empirical, objective research that is guided by best practices in social science research. The Institute solicits and accepts funding only for activities that are consistent with our mission. No funder shall determine research findings, conclusions, or recommendations made by the Institute. Gender Equity Policy Institute retains rights in intellectual property produced during and after the funding period. We provide funders with reproduction and distribution rights for reports they have funded. Gender Equity Policy Institute is solely responsible for the content of this report.